Vitamin D Foods, Deficiency Signs, and Dietary Sources: USDA FDC Data 2026
Vitamin D Foods, Deficiency Signs, and Dietary Sources: USDA FDC Data 2026
This article is for informational purposes only and is not medical advice. Consult a qualified healthcare provider before making changes to your diet, starting supplementation, or interpreting any lab result.
Building HealthSavvyGuide as a thin aggregation layer on top of the USDA FoodData Central (FDC) API, I keep returning to one micronutrient that breaks the usual pattern: vitamin D. Most vitamins live in dozens of common foods at meaningful levels. Vitamin D does not. When I query the FDC dataset for nutrient ID 1114 (Vitamin D D2 + D3) across the SR Legacy and Foundation food sets, the distribution is steep — a small handful of foods carry most of the dietary load, and the long tail is essentially zero. That data shape is the reason vitamin D deficiency is so common in the first place, and it is why this article is structured around what the USDA database actually contains rather than around generic "top 10" lists.
What the USDA Database Actually Shows
The FDC field for vitamin D is reported in micrograms (µg) per 100 g of food, with a conversion factor of 1 µg = 40 IU. Pulling the Foundation and SR Legacy slices and sorting by Nutrient 1114, the top entries cluster into a narrow group:
- Cod liver oil: ~250 µg per 100 g (10,000 IU). Outlier at the top; rarely eaten by volume.
- Wild rainbow trout, cooked: ~16 µg per 100 g (640 IU).
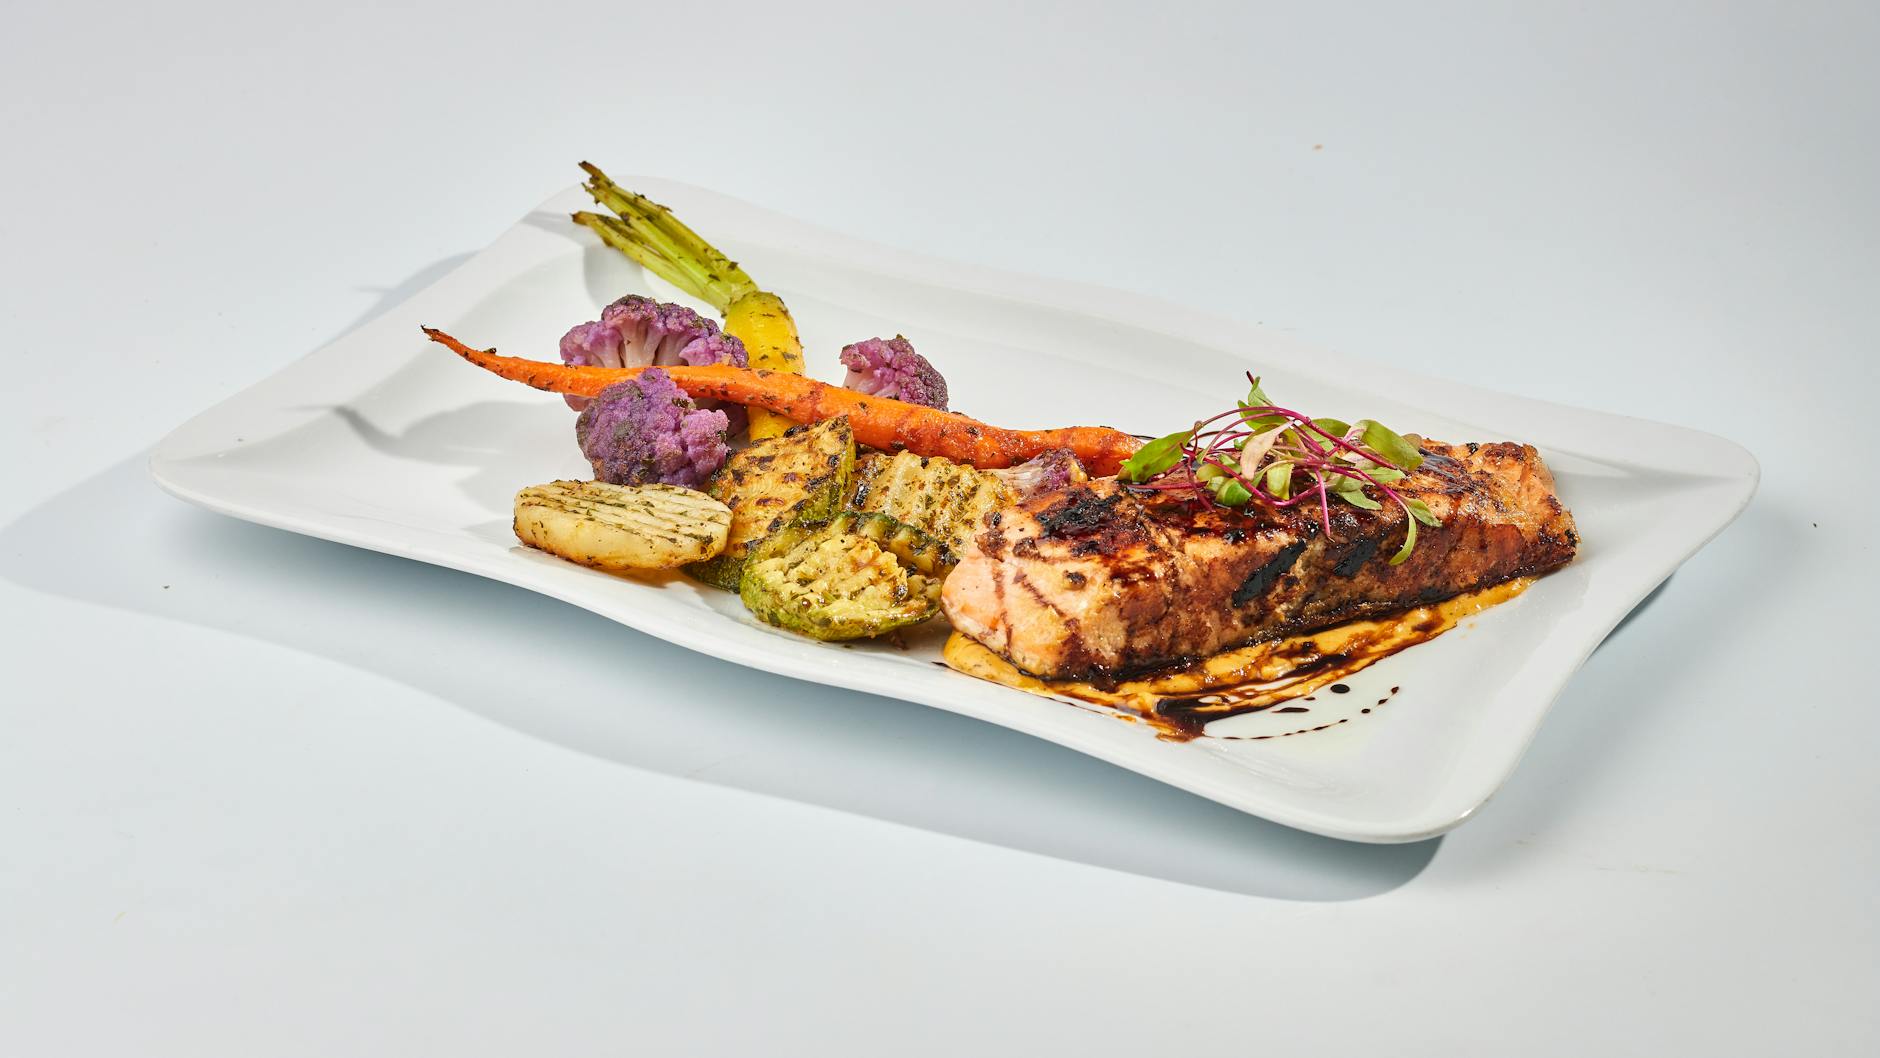
- Atlantic salmon, wild, cooked: ~14.2 µg per 100 g (570 IU).
- Atlantic salmon, farmed, cooked: ~11 µg per 100 g (440 IU).
- Sockeye salmon, canned: ~17 µg per 100 g (680 IU), bones included.
- Sardines, canned in oil, drained: ~4.8 µg per 100 g (193 IU).
- Tuna, light, canned in water: ~1.7 µg per 100 g (68 IU).
- Egg yolk, raw: ~5.4 µg per 100 g (218 IU). Whole egg is lower because the white contributes none.
- Beef liver, cooked: ~1.2 µg per 100 g (49 IU).
- Shiitake mushrooms, dried: ~3.9 µg per 100 g (154 IU), almost entirely D2.
- UV-exposed white mushrooms: variable, often labeled at 10–20 µg per 100 g.
- Fortified cow milk, 2%: ~1.3 µg per 100 g (~120 IU per cup).
- Fortified plant milks (soy, almond, oat): usually labeled to match dairy at ~100–130 IU per cup.
- Fortified breakfast cereals: variable, typically 2.0–2.5 µg per serving on the Nutrition Facts label.
The first engineering observation is that the unfortified food universe is shockingly thin. Outside of fatty fish, egg yolks, and UV-treated mushrooms, naturally occurring vitamin D in the USDA dataset is mostly noise at or below 0.5 µg per 100 g. Removing fortification from the picture leaves only ~25 foods in the entire SR Legacy set that exceed 5 µg per 100 g — and most of them are fish.
The second observation is the D2/D3 split. The FDC API exposes nutrient 1110 (Vitamin D2 ergocalciferol) and 1111 (Vitamin D3 cholecalciferol) separately, with 1114 as the sum. Animal foods carry D3; fungal foods carry D2. The two are not biologically equivalent — research summarized by the NIH Office of Dietary Supplements indicates D3 raises serum 25-hydroxyvitamin D more efficiently than D2 — but the FDC dataset treats them as additive in the summary field. Worth knowing when reading a label.
Why Sunlight Still Dominates the Math
Even the densest food sources struggle to reach the Recommended Dietary Allowance. The current RDA for adults 19–70 set by the Institute of Medicine and reaffirmed by NIH is 15 µg (600 IU) per day, rising to 20 µg (800 IU) at age 71. To hit 15 µg from food alone without fortification, you would need roughly 105 g of cooked wild salmon, or about three large egg yolks plus a serving of sardines. Most days, most people do not eat that.
Skin synthesis is the lever the body evolved around. The WHO/IARC review of UV exposure) notes that brief, casual sun exposure on the arms and face — on the order of 5–15 minutes a few times per week at midday in temperate latitudes — can produce meaningful vitamin D. The exact dose depends on latitude, skin pigmentation, age, and season. Above roughly 35° latitude, the winter sun angle is too oblique for the relevant UVB wavelengths (290–315 nm) to reach the skin, which is why deficiency rates spike from November through March in northern populations.
This is the engineering reason a "food only" strategy underperforms in the database. The USDA dataset does not contain the food that built our species' vitamin D status — sunlight — and aggregating around it without that caveat would give a misleading picture.
Deficiency Signs and Clinical Thresholds
Vitamin D status is measured in serum 25-hydroxyvitamin D, abbreviated 25(OH)D, reported in ng/mL or nmol/L (1 ng/mL = 2.5 nmol/L). According to the NIH ODS clinician fact sheet, commonly cited cutoffs are:
- <12 ng/mL (30 nmol/L): deficient; associated with rickets in children and osteomalacia in adults.
- 12–20 ng/mL (30–50 nmol/L): inadequate for bone and overall health.
- 20–50 ng/mL (50–125 nmol/L): adequate.
- >50 ng/mL (125 nmol/L): potential adverse effects, particularly above 60 ng/mL.
The signs that prompt a 25(OH)D test, summarized by Mayo Clinic and Cleveland Clinic, include:
- Persistent fatigue not explained by sleep or workload.
- Bone or back pain, particularly in the lower back, hips, and ribs.
- Muscle weakness, cramping, or twitching.
- Mood changes; some studies note an association with seasonal low mood.
- Frequent infections or slow wound healing.
- In children, delayed growth or bowed legs (rickets).
- In adults, soft bones (osteomalacia) and increased fracture risk.
These symptoms overlap with many other conditions. A blood test is the only way to confirm status. None of the symptoms above are specific enough to act on without one. If any of these are persistent, the right next step is a clinician visit, not a self-prescribed supplement.
Groups at Higher Risk
Several populations show consistently lower 25(OH)D in CDC NHANES surveillance data:
- Higher melanin skin tones: melanin reduces UVB-driven cutaneous synthesis, so the same sun exposure produces less vitamin D.
- Adults over 65: skin synthesizes vitamin D less efficiently with age, and indoor time tends to increase.
- Exclusively breastfed infants: human milk is low in vitamin D, which is why the American Academy of Pediatrics recommends 400 IU/day supplementation from the first days of life.
- People with malabsorption conditions (Crohn's, celiac, cystic fibrosis, post-bariatric surgery): fat-soluble vitamins absorb poorly without adequate dietary fat and intact intestinal surface.
- People who cover most skin or stay indoors: religious or occupational dress, shift workers, and homebound elderly all show elevated rates.
- Higher latitudes: above ~35°, winter UVB is effectively absent.
- Obesity (BMI ≥30): vitamin D sequesters in adipose tissue, lowering circulating 25(OH)D for the same intake.
If you fall into more than one of these categories, the food data alone almost certainly does not solve the problem. This is one of the rare cases where talking to a clinician about testing 25(OH)D is the high-information move.
Mushrooms: The One Plant Source That Behaves Differently
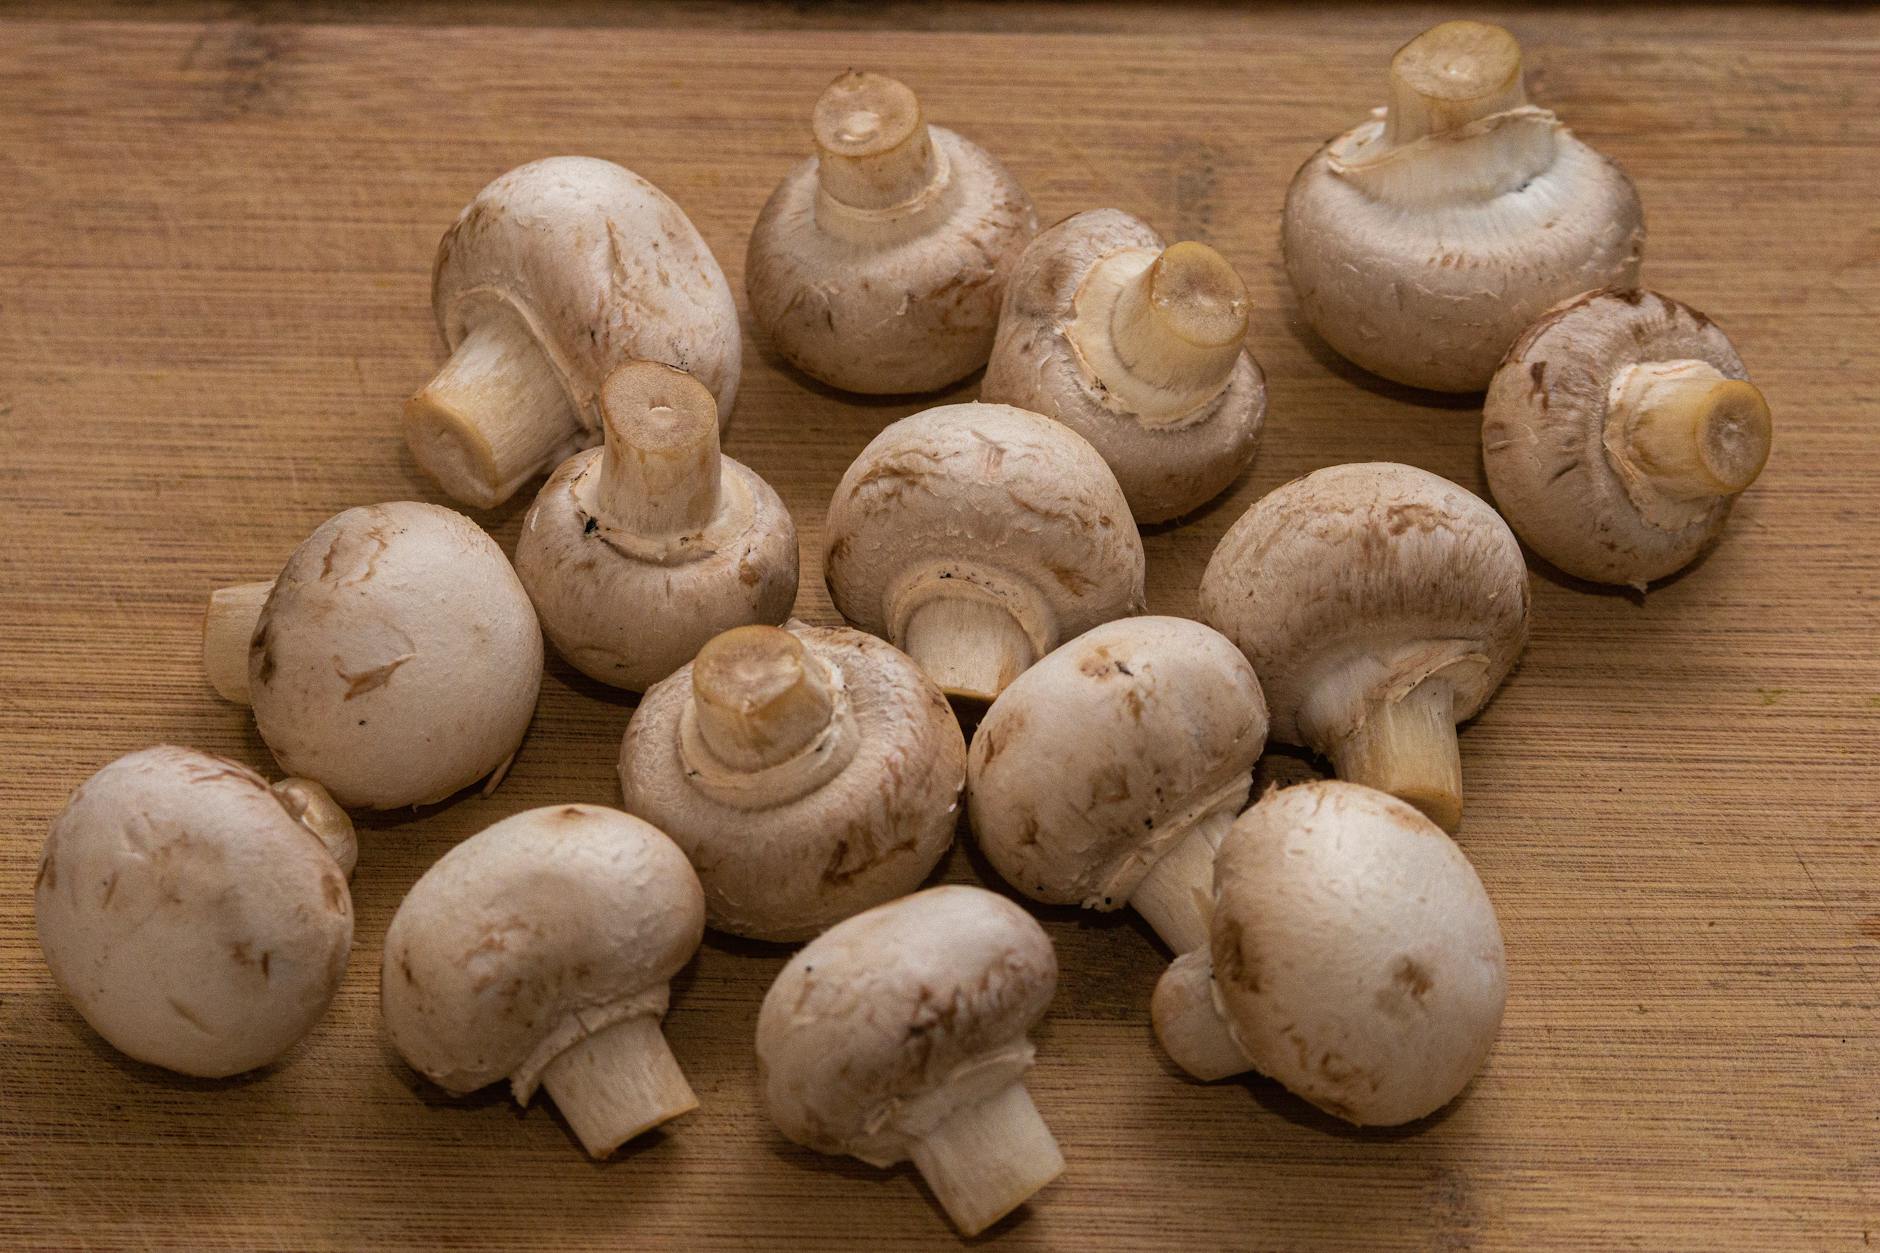
When I built the food filter for the HealthSavvyGuide aggregator, mushrooms broke my code path twice — once because the FDC dataset has both raw and UV-exposed versions of the same mushroom species, and again because the UV-exposed entries carry vitamin D2 values orders of magnitude higher than their non-treated counterparts.
According to the USDA Agricultural Research Service, mushrooms contain ergosterol that converts to vitamin D2 when exposed to UVB light. Commercial growers now do this deliberately. The result is that a single serving of UV-exposed white button mushrooms can reach 10 µg or more, putting them on par with farmed salmon. This is a real engineering anomaly in the dataset — a plant food that competes with fish for vitamin D content, but only when it carries a "UV-exposed" or "vitamin D enhanced" label. Untreated mushrooms are negligible.
For people building a plant-forward eating pattern, this is the highest-leverage substitution in the entire dataset.
Supplementation: What the Evidence Actually Supports
Supplementation is YMYL territory, so I am explicitly deferring to authoritative sources rather than giving guidance. The NIH ODS sets the Tolerable Upper Intake Level at 100 µg (4,000 IU) per day for adults — chronic intake above that increases the risk of hypercalcemia. The Endocrine Society clinical practice guideline recommends testing in at-risk populations rather than universal supplementation, and individualizes dose based on baseline 25(OH)D.
Two practical engineering notes from reading the labels:
1. Most over-the-counter supplements are D3 (cholecalciferol) derived from lanolin or lichen. Vegan options are lichen-derived.
2. Vitamin D absorbs with dietary fat. Taking a supplement with a meal that contains some fat — yogurt, avocado, eggs, oily fish — improves absorption. Taking it on an empty stomach or with a fat-free meal is documented in Cleveland Clinic guidance as suboptimal.
None of that is a recommendation to start supplementing. It is a description of how the supplements behave for people who already have a clinician-directed prescription.
A Practical Food Pattern, Drawn from the Data
If you wanted to build a week of eating that maximizes vitamin D from the USDA database without supplements, the data suggests something like this (illustrative, not prescriptive):
- 2–3 servings of fatty fish per week — salmon, sardines, mackerel, or trout. Canned sockeye salmon with bones doubles as a calcium source.
- Eggs at 4–6 yolks per week if your clinician has not flagged cholesterol concerns.
- UV-exposed mushrooms as a regular swap into stir-fries, omelets, and grain bowls.
- Fortified milk or fortified plant milk as the default beverage rather than unfortified versions.
- Fortified cereal or oatmeal for breakfast on days when fish or eggs are not on the plate.
That pattern, run consistently, can deliver 8–15 µg/day from food. Whether it is enough depends on sun exposure, latitude, season, skin tone, age, body composition, and absorption — all the variables the FDC database does not contain. The right way to know is a 25(OH)D test ordered through a clinician.
Frequently Asked Questions
Is vitamin D really a vitamin? Biochemically, it functions as a prohormone. The active form, calcitriol, is produced from 25(OH)D in the kidneys and acts on receptors throughout the body. It is grouped with vitamins because we obtain it from the diet (and sun) rather than synthesizing it from amino acids.
Can you get enough vitamin D from sun alone in winter? Above roughly 35° latitude, no. UVB wavelengths required for skin synthesis do not reach the surface at sufficient intensity from late autumn through early spring. This is one reason CDC and NIH surveillance shows seasonal 25(OH)D dips in northern populations.
Is sunscreen blocking vitamin D production a real concern? In controlled studies cited by the WHO), SPF reduces but does not eliminate cutaneous vitamin D synthesis, especially given that most people apply sunscreen unevenly and in insufficient quantity. The skin cancer prevention benefit of sunscreen is well established. Adequate vitamin D status is achievable alongside daily sunscreen use through diet, fortified foods, and clinician-directed supplementation where appropriate.
Does cooking destroy vitamin D in fish? The USDA dataset shows that cooked fatty fish retains the large majority of its vitamin D content. Vitamin D is fat-soluble and reasonably heat-stable, so baking, grilling, or pan-cooking salmon does not collapse the value.
What about vitamin D in yogurt and cheese? Most yogurt and cheese in the USDA dataset shows negligible vitamin D unless explicitly fortified. Check the Nutrition Facts label rather than assuming dairy automatically contains it.
Closing Note
The most honest takeaway from running this query against the FDC dataset is that vitamin D is the one micronutrient where the database alone is not the answer. The food sources are concentrated in a narrow group, sunlight does not appear in the dataset, individual factors swing the math by 5x or more, and the only reliable way to know your status is a 25(OH)D test interpreted by a clinician. The engineering goal of an aggregator like HealthSavvyGuide is to give you the food-data layer cleanly; the clinical layer belongs to a qualified provider.
This article is for informational purposes only and is not medical advice. Always consult a qualified healthcare provider for diagnosis, treatment, and personalized guidance.
Sources consulted: NIH Office of Dietary Supplements, U.S. Centers for Disease Control and Prevention (NHANES), WHO/IARC, Mayo Clinic, Cleveland Clinic, USDA FoodData Central, USDA Agricultural Research Service, American Academy of Pediatrics, Endocrine Society.
Found this helpful?
Subscribe to our newsletter for more in-depth reviews and comparisons delivered to your inbox.