Vitamin B3 (Niacin) Deficiency Foods: USDA FDC Data Review 2026
Building HealthSavvyGuide on the USDA FoodData Central (FDC) API, I noticed something while running queries against the niacin field (FDC nutrient ID 1167): of the 1,465+ foods I'd indexed, only a narrow band returned values above 10 mg per 100 g. That observation kicked off a deeper data dive into vitamin B3, the most metabolically active member of the B-complex family and the one with the most interesting historical footprint.
This article is for informational purposes only and is not medical advice. Consult a qualified healthcare provider before changing your diet, starting any supplement, or interpreting symptoms you think may be related to a vitamin deficiency. I am a software engineer building food and nutrition aggregators, not a registered dietitian or clinician.
What Vitamin B3 Actually Is (Three Forms, One Coenzyme System)
Vitamin B3 is a label that covers three related compounds: nicotinic acid, nicotinamide (also called niacinamide), and a more recently studied form, nicotinamide riboside. The body converts all three into two coenzymes that drive energy metabolism: nicotinamide adenine dinucleotide (NAD+) and its phosphorylated cousin (NADP+). According to the National Institutes of Health Office of Dietary Supplements (ODS), these coenzymes participate in more than 400 enzyme reactions, more than any other vitamin-derived coenzyme.
From an engineering perspective, what makes the FDC niacin field tricky is that it captures the preformed niacin in food but not the niacin equivalents (NE) contributed by tryptophan, an essential amino acid the body can convert to niacin at a roughly 60-to-1 ratio (60 mg tryptophan yields about 1 mg niacin). The official Recommended Dietary Allowance is expressed in NE, while most food databases list raw mg. That gap is one reason high-protein, low-niacin diets rarely produce deficiency in healthy adults.
Reading the USDA FDC Niacin Field: What the Data Shows
When I aggregated USDA FoodData Central entries on the niacin nutrient ID 1167, the distribution was sharply skewed. Most plant foods sit below 2 mg per 100 g. A small group of animal proteins, organ meats, and a handful of fortified cereals dominate the upper end. Below is a snapshot from the FDC SR Legacy and Foundation Foods datasets, rounded for readability.
| Food (USDA FDC) | Niacin (mg/100 g) | FDC Category |
|---|---|---|
| Yeast extract spread (Marmite-type) | ~64 | Spices and condiments |
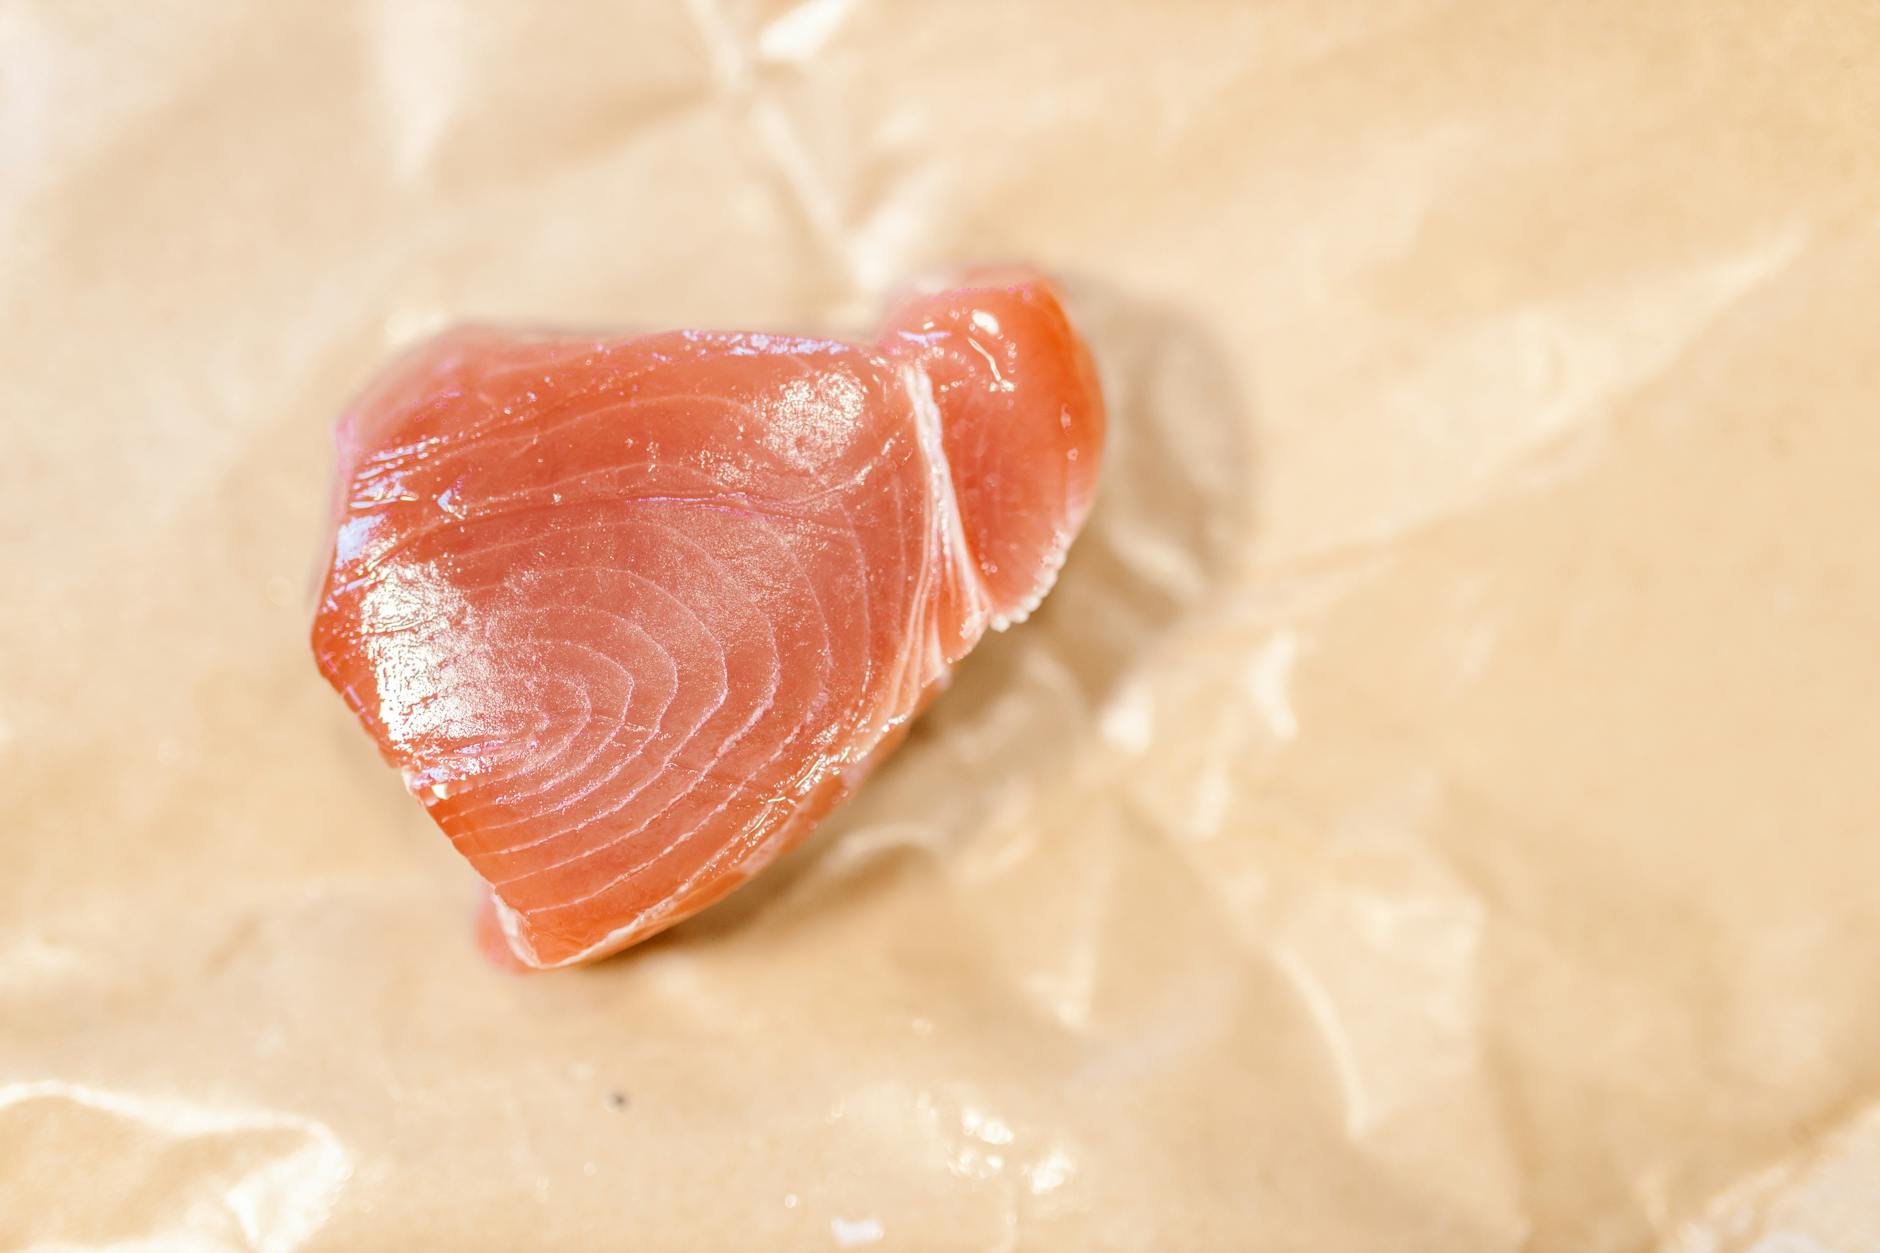
| Tuna, yellowfin, raw | ~18.5 | Finfish |
| Chicken breast, roasted, skinless | ~13.7 | Poultry |
| Beef liver, pan-fried | ~17.5 | Beef, variety meats |
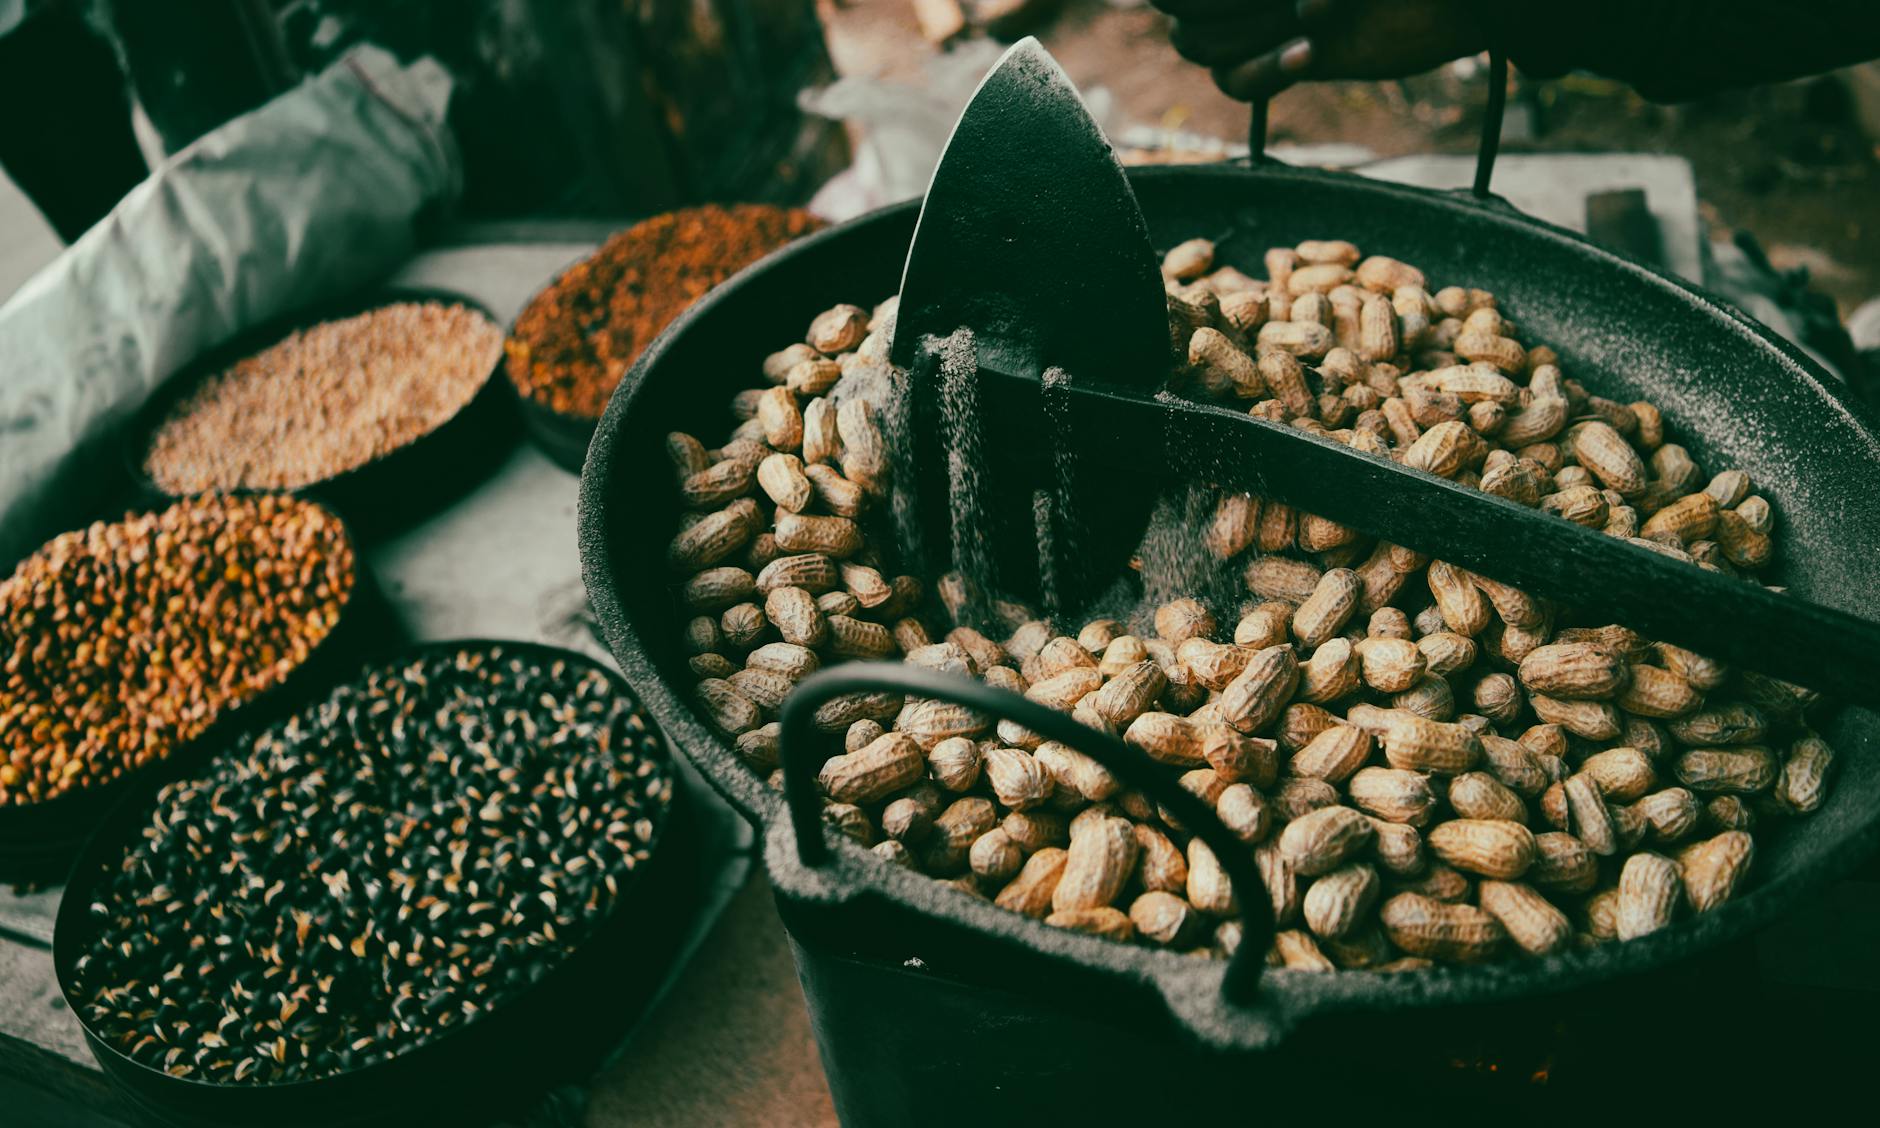
| Peanuts, dry-roasted | ~13.5 | Legumes and pulses |
| Salmon, sockeye, cooked | ~10.0 | Finfish |
| Fortified breakfast cereal (avg) | ~20 | Cereal grains |
| Brown rice, cooked | ~1.5 | Cereal grains |
| Spinach, raw | ~0.7 | Vegetables |
Two patterns jumped out from the aggregation. First, the spread between fortified cereals and unfortified whole grains is one of the largest in the FDC dataset for any single nutrient. A serving of fortified flake cereal can deliver more niacin than a 100 g portion of salmon. Second, organ meats consistently outrank muscle meats by a measurable margin, which lines up with what nutrition textbooks have said for decades but is worth seeing as actual numbers in a structured database.
Niacin Equivalents (NE): Why the RDA Math Looks Strange
The RDA from the NIH ODS is 16 mg NE per day for adult men and 14 mg NE for adult women, with higher values during pregnancy (18 mg NE) and lactation (17 mg NE). The "NE" suffix is doing a lot of work. One niacin equivalent equals 1 mg of preformed niacin or 60 mg of dietary tryptophan. That conversion ratio is why a person eating adequate protein rarely hits a true niacin deficit, even on a moderate-niacin diet.
For an engineering audience used to clean unit conversions, this is the kind of thing that breaks naive aggregation. If you build a daily-intake tracker that sums only the niacin field, you will systematically underestimate functional B3 status for high-protein eaters and overestimate it for fortified-cereal-heavy diets where tryptophan intake is low. Any nutrition tool worth its salt has to compute NE from the niacin field plus a tryptophan estimate, and FDC does expose tryptophan separately as nutrient ID 1210.
Deficiency: Pellagra and the Three D's
Severe niacin deficiency causes pellagra, historically described by the "three D's": dermatitis, diarrhea, and dementia, with a fourth D, death, if untreated. The CDC and the World Health Organization both note that pellagra is now rare in countries with diverse diets and food fortification programs but still appears in populations dependent on corn-based diets without nixtamalization, in alcohol use disorder, in some malabsorption conditions, and in carcinoid syndrome where tryptophan is diverted to serotonin synthesis.
The history here is one of the most interesting public-health stories in nutrition. In the early 1900s, pellagra was endemic across the southern United States, with hundreds of thousands of cases. Joseph Goldberger's epidemiological work between 1914 and 1929 showed it was diet-related, not infectious, well before niacin was identified in 1937. Once enriched flour and fortified cereals became standard mid-century, the disease essentially disappeared from the U.S. food supply. That historical arc is one reason fortification programs sit near the top of the WHO's list of effective public-health interventions.
Populations Worth Watching
The NIH ODS lists several groups where suboptimal niacin status is more plausible: people with chronic alcohol use disorder, individuals with anorexia nervosa or severely restricted eating patterns, people on long-term isoniazid therapy (which interferes with B6 and indirectly with the tryptophan-to-niacin pathway), and patients with Hartnup disease, a rare genetic condition affecting tryptophan absorption. For most healthy adults eating a varied diet that includes any combination of poultry, fish, peanuts, or fortified grains, frank deficiency is uncommon.
That does not mean niacin is irrelevant outside of deficiency. Pharmacologic doses of nicotinic acid have been studied for decades for their effects on lipid profiles, and prescription-grade niacin has long held a place in cardiovascular practice, though the evidence on hard outcomes has shifted over the years. This article is not the place for that discussion, and it is firmly in the territory where a clinician's input matters.
The Niacin Flush: A Real Pharmacology Lesson
One observation I keep seeing in supplement reviews is the so-called niacin flush, a warm, tingling, red-faced reaction that follows oral nicotinic acid above roughly 30 to 50 mg in unaccustomed users. According to NIH ODS materials, the flush is a prostaglandin-mediated vasodilation, harmless in itself but uncomfortable enough that many people misread it as an allergic reaction. Nicotinamide and nicotinamide riboside generally do not cause the flush, which is one reason supplement formulations vary so much.
The Tolerable Upper Intake Level (UL) set by the Food and Nutrition Board is 35 mg per day from supplements and fortified foods combined for adults, well below pharmacologic doses but above what most diets deliver from food alone. Hitting the UL through whole foods is essentially impossible; it is a supplement-era guardrail.
How HealthSavvyGuide Aggregates This Data
From an engineering side, the niacin field is one of the cleaner FDC nutrients to work with. It is reported consistently across the SR Legacy, Foundation Foods, and FNDDS datasets, with units in milligrams. The complications come at the analytical layer: computing NE, joining tryptophan data, and handling fortified versus unfortified versions of the same food (FDC often has both as separate entries with different FDC IDs). My aggregator currently surfaces the raw niacin number, the food's FDC ID, and a calculated NE estimate when tryptophan data is available. The underlying API is the USDA FoodData Central public endpoint, which is rate-limited but free for non-commercial use.
Practical, Evidence-Aligned Takeaways
If you take three things from a quick read of the FDC data, they would be these. Animal proteins and fortified cereals do most of the heavy lifting for niacin in the typical Western diet, and any single one of them in a daily rotation tends to cover the RDA on its own. Tryptophan from protein-rich foods provides a substantial second pathway, which is why the unit is "NE" rather than raw mg. And the upper-intake concern is a supplement issue, not a food issue, so reading the supplement label matters more than reading nutrition panels for this particular vitamin.
Frequently Asked Questions
Is niacin the same thing as niacinamide?
They are both forms of vitamin B3 and both contribute to NAD+/NADP+ pools, but they behave differently at higher doses. Nicotinic acid causes the characteristic flush; nicotinamide generally does not. The NIH ODS treats them as the same vitamin for RDA purposes but flags the differences for supplement use.
How much niacin is in a typical chicken breast?
According to USDA FDC data, roasted skinless chicken breast carries roughly 13 to 14 mg of niacin per 100 g, meaning a 150 g portion is approaching the entire adult RDA from preformed niacin alone, before counting the tryptophan contribution.
Can a vegetarian or vegan get enough vitamin B3?
The FDC data shows that peanuts, peanut butter, sunflower seeds, brown rice, and fortified cereals can together cover the RDA without animal products, especially when total protein intake supplies adequate tryptophan. Standard guidance from the Academy of Nutrition and Dietetics supports this, but individuals with restricted patterns should review their intake with a qualified clinician.
Why does the FDC show such different niacin numbers for the same cereal?
Most cereal entries in FDC distinguish fortified versus unfortified versions, and fortification levels vary by manufacturer and country. Two cereals with similar names can differ by 15 to 20 mg per 100 g depending on the formulation. Always check the FDC ID, not just the food name, when comparing.
Is the niacin flush from a supplement dangerous?
NIH ODS describes the flush as benign in healthy people, but it is uncomfortable, and any reaction to a supplement that surprises you is worth reviewing with your clinician, especially before increasing the dose. This is not medical advice; it is a pointer to the published consumer information.
Sources Referenced
- NIH Office of Dietary Supplements, Niacin Health Professional Fact Sheet
- USDA FoodData Central, nutrient ID 1167 (niacin) and 1210 (tryptophan)
- Centers for Disease Control and Prevention, Pellagra historical and surveillance documentation
- World Health Organization, fortification guidance
- Food and Nutrition Board, Institute of Medicine, Dietary Reference Intakes for niacin
Medical disclaimer: This article summarizes publicly available nutritional and historical information from authoritative sources for general reading. It is not personalized dietary, medical, or nutritional advice. If you suspect a vitamin deficiency, are considering supplementation, or have a chronic condition that affects nutrient absorption, consult a qualified healthcare provider before making any change.
Found this helpful?
Subscribe to our newsletter for more in-depth reviews and comparisons delivered to your inbox.